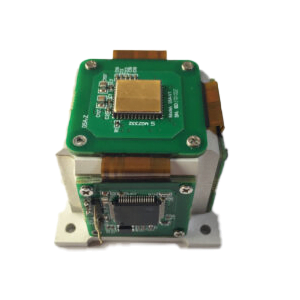
MEMS gyroscope has been widely used in the field of oil and gas, which has the advantages of small size, light weight, low power consumption and low cost, so it has become a better choice to replace other types of gyroscopes. Due to the complex downhole environment, high temperature and high pressure, the operator needs to confirm the working status of the drill rod in real time, and the drill rod often cannot accommodate larger equipment. This paper describes a micro-measuring device based on MEMS gyroscope. In the previous article, we introduced the overall design of the micro-measuring device, the development of the core system and the development of the external shell. This paper will elaborate from the laboratory experiment test and the calculation of the moving speed of the micro-measuring device.
Previous article: A downhole multiphysics measuring device based on MEMS gyroscope-1
Laboratory test
In order to further verify the measuring functions of the micrometer, indoor vertical pipe flow test, underground complex conditions simulation test and uniaxial pressure test were carried out.
1. Vertical pipe flow test
The vertical pipe flow test device is shown in Figure 6. The total height of the device is 6m, the inner diameter is 30mm, and the outer diameter is 45mm. Before the vertical tube flow test, a set of magnetic rings is placed at each collar of the vertical tube flow device, spaced about 1 m apart, for a total of 6 sets. The purpose is to enable the magnetic sensor in the core circuit to detect the sudden change of the surrounding magnetic field when the micrometer moves in the vertical pipe and passes through the position of the magnetic ring, so as to provide data support for the depth positioning of the micrometer.
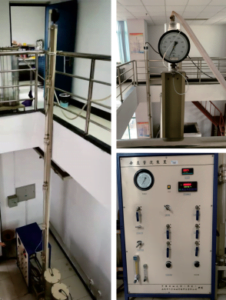
Figure 6 Vertical pipe flow experimental setup
The whole vertical pipe flow test process consists of two cycles, the first cycle is a micro measurement from the top of the vertical pipe flow device, so that it is free to sink in the fluid, when it reaches the bottom of the pipe through the control cabinet to open the flow valve, so that it with the pumped fluid back; When it returns to the top of the pipe, the flow pump is turned off to allow it to sink freely again, and the operation of the first cycle is repeated. When the micrometer returns to the top of the pipeline for the second time, it is taken out of the pipeline and connected to the upper computer through the reserved data transmission interface to upload the measurement data.
Finally, two complete cycles were completed in the vertical pipe, and the temperature and three-axis magnetic field data measured by the micro-meter were shown in Figure 7. From the measured temperature data, it can be seen that the temperature of the micro-meter gradually dropped and finally stabilized after being put into the pipe filled with cold water. This is because in order to reflect the measurement effect of the temperature sensor, before the start of the test, the surface of the micro measuring device is coated with heating glue, the glue continues to release heat after entering the water, forming a constantly changing temperature effect, which proves that the micro measuring device can sensitively detect changes in the ambient temperature. From the magnetic field data collected during the two cycles, it can be seen that the micro measuring instrument can accurately detect 6 magnetic field mutation positions during each sinking and ascending process. However, it is also found that due to the different attitude and speed of the micro measuring instrument when passing through the magnetic ring, the magnetic field intensity is different. However, for the depth calibration of the measuring instrument, the specific magnetic field size is not concerned. The main concern is the abrupt location of the magnetic field. The magnetic field data was used to calibrate the position of the tube column, and the temperature data measured by the micro measuring device during the first test cycle was converted between time and depth. The temperature variation with depth obtained was shown in Figure 8, thus proving the feasibility of depth conversion when measuring data by magnetic ring positioning.
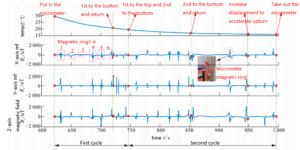
Figure 7 Experimental data of temperature and three-axis magnetic intensities
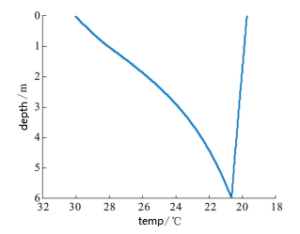
Figure 8 Temperature-depth curve
In addition to analyzing the measured temperature and magnetic field data to construct a temperature-depth curve, the measured dynamics signals (i.e., acceleration and angular rate data) can be used to determine the motion of the micrometer in the fluid, allowing for in-depth analysis of complex downhole conditions. The triaxial acceleration and triaxial angular rate measured by the micrometer during two cycles in the string are shown in Figure 9, where ax, ay and az are x, y and z axis accelerations respectively, and g is gravitational acceleration. Based on the field observation during the test, in the sinking stage of the two cycles, the falling speed of the micrometer in the pipeline static fluid is basically the same, and both are relatively slow
At the same time, its own slight oscillation and slow rotation constantly occur, so that the triaxial acceleration and triaxial angular rate signals measured in the corresponding stage have sustained small fluctuations. When the pump is started for the first time to inject fluid from the bottom of the pipeline, the displacement is set to the maximum. At this time, the micro measuring instrument quickly rises and returns with the fluid in the pipeline, and its motion posture is basically stable, without the swing and rotation when sinking in still water. Therefore, the measured triaxial acceleration and triaxial angular rate signals in the corresponding stage do not fluctuate significantly. When the pump starts the second time to inject fluid from the bottom of the pipe, the displacement set in the previous stage is small, and the micro-measuring instrument begins to swing and rotate in the fluid. After that, by further increasing the displacement to accelerate the upturn, the attitude of the micro measuring instrument eventually tends to be stable. The triaxial acceleration and triaxial angular rate signals measured at the corresponding stage also well reflect these phenomena, which shows that the dynamic signal characteristics measured by the micro measuring instrument can be well consistent with the actual working conditions.
Based on the above analysis of the test results, it can be seen that the fluid flow velocity has an obvious effect on the hydrodynamic performance of the micrometer. When the fluid flow rate is fast, the micro measuring instrument can keep the cooperative movement with the fluid basically, and it can keep the attitude stable better. When the flow rate is reduced, the sliding effect of the micrometer in the fluid begins to become obvious, and its own stability is difficult to maintain. In addition, the rheological properties of the fluid and the shape and structure of the micrometer will have significant effects on its hydrodynamic performance. Therefore, it is necessary to comprehensively consider the above factors to optimize the hydrodynamic performance of the micrometer, so as to improve its mobility efficiency and dynamic stability in different fluid environments.
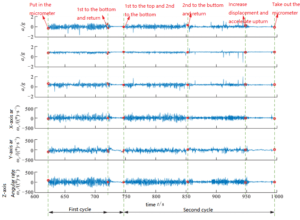
Figure 9 Experimental data of three-axis acceleration sand angular rates
2. Simulation test of complex underground conditions
On the basis of verifying the measuring function of the micro measuring instrument for temperature, magnetic field and dynamic signal, the simulation test of complex underground working conditions is further carried out. Firstly, in order to simulate the downhole leakage condition, a drain valve is installed at the fifth collar of the vertical string. After the simulation test began, the valve was opened to make the fluid in the pipe string leak outward, and the micro measuring device was allowed to pass the data acquisition from the leak point. The dynamic signal obtained was shown in Figure 10. It can be seen that before and after passing through the leakage port, the dynamic signal collected by the micro measuring device has been fluctuating. When it is sucked by the leakage port and kept stationary, its triaxial acceleration and triaxial angular rate data form a straight line. It can be seen that if the linear data segment is detected in the dynamic signal, it can be used as a key feature to judge the downhole leakage condition.
After the simulation test of leakage condition is completed, the downhole overflow condition is further simulated. During the simulation test, the air pump valve was opened and air was pumped into the pipe string. With the increase of air intake, obvious bubble-like flow appeared in the pipe string. During this process, the dynamic signal collected by the micro-measuring instrument was shown in Figure 11. As can be seen from Figure 11, the corresponding dynamic signal of the micro measuring instrument fluctuates slightly before and after it is traversed by bubbles of bubble-like flow. However, when the crossing occurs, the triaxial acceleration and triaxial angular rate signal change significantly, and there are peaks. In contrast to the phenomenon observed in the experiment, in the bubble flow environment, the micro measuring instrument will be pushed by the bubble flow and move up quickly. When the bubble of the bubble flow touches the micro measuring instrument, the micro measuring instrument will move in free fall until it encounters the fluid again because there is no fluid support inside the bubble. It is precisely because the micro measuring instrument will fall down inside the bubble of bubbling flow, its axial acceleration and corresponding angular rate will change dramatically, which is also the reason for the dynamic signal peak in Figure 11, which can be used as a key feature for the identification of downhole overflow conditions.
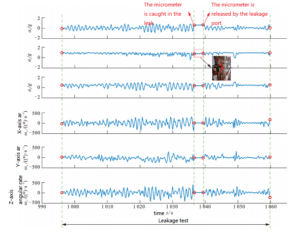
Figure 10 Leakage test based on dynamic signal
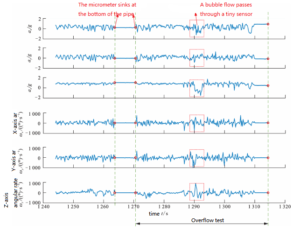
Figure 11 Overflow test based on dynamic signal
Calculation of moving speed of micrometer
The data measured by the micrometer in the pipeline are all time series, but in the complex downhole judgment, more attention is paid to the physical parameter information corresponding to the downhole depth, and it is necessary to establish the conversion relationship between the measured data time and depth. Although the magnetic sensor installed in the micrometer can be used for depth positioning, when it is applied to the actual wellbore measurement without magnetic ring calibration, the depth information cannot be effectively obtained. Theoretical methods are needed to calculate the moving speed of the micrometer in the pipeline fluid to realize the depth positioning of the micrometer.
The moving speed vb of the micrometer in the pipeline fluid is equal to the difference between the flow rate vl of the fluid and its slip speed vt, that is:
vb=vl-vt
The slip speed of the micrometer is related to the disorder of the flow field in which it is located, that is, to the Reynolds number:

Where, ρm is the fluid density, kg/m3; ds is the diameter of the micro measuring instrument, m; μm is the fluid viscosity, pa·s.
The Reynolds number of the flow field determines the resistance coefficient CD corresponding to the fluid resistance received by the micro measuring instrument. According to the different factors considered, different scholars have proposed three calculation models of the moving speed A, B and C:
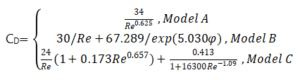
Where, is the sphericity coefficient of the micro measuring instrument, usually spherical measuring instrument =1, capsule measuring instrument =0.8, bullet measuring instrument =0.82.
By combining the above three formulas, by bringing the resistance coefficient CD containing the moving speed vb into the force balance equation of the micro measuring device in the fluid, the moving speed vb of the micro measuring device in the pipeline fluid can be calculated.
Where, the force of W micrometer in fluid, that is, the difference between gravity and buoyancy,N; R is the viscous resistance of fluid,N; ρs is the density of the micrometer,kg/m3.
The different shape of the shell of the micro-measuring instrument will make it have different hydrodynamic performance when moving in the pipeline fluid. For this reason, three kinds of micro-measuring instruments of different shapes, capsule shaped, bullet shaped and spherical shaped, were put into the test process. The whole video shooting was conducted during the test process and several groups of tests were carried out. Finally, the comparison between the test speed and the model calculation speed of the three different shapes of micro-gauges was obtained, as shown in Figure 12.
From the comparison of velocities, it can be seen that due to the existence of slip velocity, the moving speed of the micrometer in the fluid is slower than the flow velocity of the fluid. Among the three calculation models corresponding to different resistance coefficients, model B takes into account the influence of the shape of the micrometer, that is, the sphericity coefficient is introduced, and its calculation result (purple curve) is closest to the test result (red thick line), while the calculation result of the improved model C is better than that of the basic model A.
Comparing the three different shapes and structures of the micro measuring instrument, the test results of the capsule measuring instrument are in good agreement with model B. The bullet type measuring instrument overlaps with model A and model B in different measuring sections. There are some differences between the three theoretical calculation models and the test results of the spherical measuring instrument, which can not predict its moving speed in the tube flow well.
Figure 12 Comparisons between experimental and theoretical speeds for microchip measuring device with different shapes
Conclusion
In this paper, a micro measuring device based on MEMS gyroscope with low power consumption, small structure size, high temperature and high pressure resistance is developed, which can realize multi-physical field collaborative measurement of temperature, pressure, magnetic field and dynamic signal. In the vertical pipe flow test, magnetic ring is used to calibrate the depth of the pipe column, and the time-depth conversion relationship is determined based on the measured peak point of the magnetic field, and then the temperature profile of the whole pipe column is obtained, which proves the feasibility of the time-depth conversion of the measured data by magnetic ring positioning. Two common complex conditions, leakage and overflow, are simulated in the experiment. It is found that the leakage condition may occur when linear data segments appear in the dynamic signals detected by the micrometer. When the dynamic signal peaks, there may be overflow conditions.
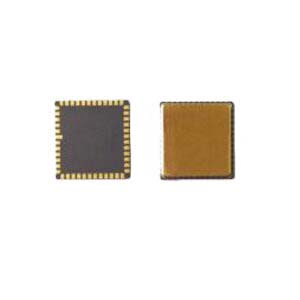
In the face of the simulated complex working environment, we should consider its volume, temperature, adaptability, etc. when using MEMS gyroscope and other equipment for work. ER-MG2-022, as a MEMS gyroscope specially developed by Ericco for oil and gas field, can reach 125℃ with bias instability <0.02°/hr and angular random walk <0.025°/ √h.
If you are interested in additional information about MEMS gyroscope, please contact us.
More Technical Questions
1.Research on scale factor nonlinearity of MEMS gyroscope
2.Analysis of drive loop noise of MEMS gyroscope
3.Bias Temperature Compensation Analysis of MEMS Gyroscope
4.Borehole north finding: Shock vibration compensation for MEMS gyroscope
5.How does MEMS gyroscope work in harsh high temperature environment?
6.A Downhole Multiphysics Measuring Device Based On MEMS Gyroscope-1
Products in Article
.jpg)