
MEMS gyroscope is a kind of angular velocity sensor made of silicon material combined with Micro-Electro-Mechanical Systems (MEMS) technology. Due to the advantages of silicon materials and MEMS technology, MEMS gyroscope has the advantages of small size, light weight, high reliability and good dynamic performance compared with traditional mechanical gyro and optical gyro, and has been widely used in various fields of civil consumption and national defense.
In recent years, the research of MEMS gyroscope has been continuously advanced, in order to adapt to more severe application scenarios, the performance requirements of gyroscope are becoming higher and higher. Among them, the gyroscope noise performance and scale factor nonlinearity are two very important indicators, through the improvement of these two aspects of performance can greatly improve the accuracy of the gyroscope and cope with high dynamic environment performance.
The purpose of this paper is to analyze the drive loop noise of MEMS gyroscope. The following will introduce the drive loop noise model, the influence of drive loop noise on the detection loop and the simulation of drive loop noise model.
Drive loop noise model
Before the gyroscope drive loop noise analysis, the following assumptions are made:
(1) When the gyroscope drive loop is stable, the drive mode is in a stable vibration state. Since the AGC and PLL links used in this paper are implemented in a digital system, the output can be considered to be a constant and ideal value, so the driving force output generated by AGC and PLL is taken as the starting point for the noise analysis of the drive loop in this paper.
(2) Since each component in the circuit has circuit noise, in order to simplify the analysis, the circuit noise located in each link of the linear system is equivalent to the first level input and classified as a noise source for analysis and research.
Based on the above assumptions, the noise transfer model of the drive loop is shown in Figure 1, where Nefx(t),Nmx(t)and Nepx(t) represent the electrical noise of the torquer, the mechanical thermal noise of the gyro and the electrical noise of the interface circuit respectively. Kvfx is the volt-electrostatic conversion gain. Kxc is displacement-capacitance conversion gain; Kax is the capacitance-voltage gain and the total gain of front-end amplification.
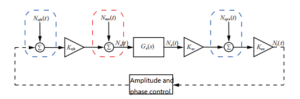
Figure 1 Drive loop noise model
To facilitate the analysis and calculation, the following analysis will use the bilateral power spectral density function, and the bilateral power spectral density of the three noise sources in the model is as follows:
SNefx(ƒ)=2kBTRfx+Kffx/|ƒ|
SNmx(ƒ)=2kBTCx
SNepx(ƒ)=2kBTRpx+Kfpx|ƒ|
In the formula, Rfx and Rpx are the equivalent resistance of the torquer circuit and the interface circuit in the drive loop respectively, and cx is the equivalent damping of the gyroscope drive mode.
Then the power spectral density of the gyroscopic driving force noise Na(t) can be calculated as:
SNa(ƒ)=K2vfxSNefx(ƒ)+SNmx(ƒ)
The power spectral density of noise Nx(t) after gyro drive mode Gx(s) is:
SNx(ƒ)=|Gx(ƒ)|2SNa(ƒ)
=K2vfx|Gx(ƒ)|2SNefx(ƒ)+|Gx(ƒ)|2SNmx(ƒ)
Among them,
Then the power spectral density of the total output noise Nt(t) of the interface circuit can be obtained as follows:
SNt(ƒ)=K2ax[K2xcSNx(ƒ)+SNepx(ƒ)]
=K2axK2xcK2vfx|Gx(ƒ)|2SNefx(ƒ)+K2axK2xc|Gx(ƒ)|2SNmx(ƒ)+K2axSNefx(ƒ)
Influence of drive loop noise on detection loop
Through the analysis of the whole measurement and control system of gyroscope, we can know that the influence of the gyroscope driving loop on the detection loop is mainly concentrated in two aspects. One is to drive the output of the PLL in the loop, and the phase signal of the output of the PLL will affect the detection loop as the reference of phase-sensitive demodulation in the detection loop; The second is the amplitude of the drive displacement. According to the Coriolis effect, the amplitude of the drive displacement is a variable in the Coriolis force expression, and the noise superimposed on the amplitude of the drive displacement will directly affect the Coriolis force and eventually affect the output of the detection channel.
When discussing the influence of drive loop noise on the detection loop, this paper mainly considers the influence of the second factor, focusing on the noise superimposed on the drive displacement amplitude after the noise is driven by the silicon micromechanical gyroscope mode, that is, Nx(t) in Figure 1, which will directly affect the detection loop.
Firstly, the influence of noise sources Nefx(t) and Nmx(t) is studied, and the power spectral density diagram of Nefx(t) and Nmx(t) can be drawn, as shown in Figure 2.
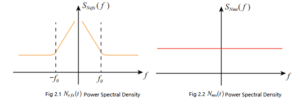
Figure 2 Power spectral densities of Nefx(t) and Nmx(t)
It can be seen from Figure 2.1 that 1/ƒ noise plays a dominant role in the low frequency band, while white noise plays a dominant role in the high frequency band. The frequency ƒ0, which intersects the two noises, is called the transition frequency, usually within tens of Hertz. As can be seen from Figure 2.1, Nmx(t) is pure white noise, and the power spectral density of white noise is a straight line in the whole frequency band.
Next, the driving force noise Na(t) is analyzed, and its power spectral density can be obtained according to the formula shown in Figure 3.
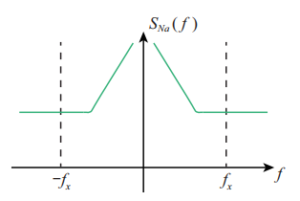
Figure 3. Na(t) power spectral density
It can be seen from the figure that near the gyroscope drive resonant frequency of ƒx, the influence of 1/ƒ noise can be ignored and can be approximately regarded as white noise, and the noise energy is the superposition of mechanical thermal noise and electronic thermal noise amplified by the torturer.
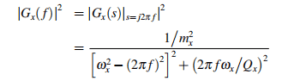
The driving force noise Na(t) next drives the mode through the gyroscope, and the transfer function of the gyro-driven mode is:
![]()
By substituting the actual parameters of the gyroscope into the transfer function, the Bod diagram curve near the gyroscope driving resonant frequency is shown in Figure 4. As can be seen from the figure, signals near the resonant frequency are significantly amplified after passing through the gyroscope drive mode, while signals farther away from the resonant frequency are suppressed after passing through the drive mode, and signals at the resonant point show a phase shift of -Π/2. The gyroscope drive mode shows obvious band-pass characteristics, which can be approximated as an ideal bandpass filter, and the larger the Qx, the narrower the bandpass filter bandwidth, the larger the resonance peak, and the stronger the anti-interference ability.
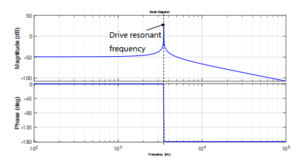
Figure 4 MEMS gyroscope drive mode baud diagram
The power spectral density of the output Nx(t) after the noise is driven by the gyro mode is as follows:
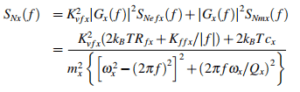
The above formula is the bilateral power spectral density function of the total noise Nx(t) whose driving mode of the gyroscope affects the detection mode, and its schematic diagram is shown in Figure 5.
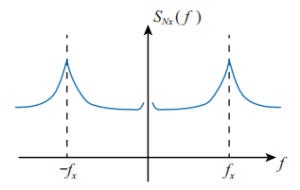
Figure 5 Nx(t) power spectral density
It can be seen from the diagram that when the noise frequency is at the driving resonance frequency, the response will peak. Since the gyroscope drive mode can be viewed as an ideal bandpass filter, and the noise can be approximately viewed as white noise before the input drive mode, Nx(t) can ultimately be viewed as a zero-mean narrow-band white noise.
Drive loop noise model simulation
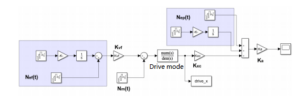
Figure 6 Simulation model of drive loop noise
In the noise model, a white noise module is used to represent mechanical thermal noise, a white noise module plus an integral module is used to represent 1/ƒ noise, and a white noise module is superimposed on the basis of 1/ƒ noise to represent circuit noise. The parameters in Table 1 are replaced into the model for simulation. According to the analysis in the previous section, it mainly focuses on the output of the drive mode, that is, the noise on the drive amplitude. Then, the sampling time of the simulation model is set to 10-6s, the sampling number is set to 107, and the output drive_x in the model is sampled. The power spectral density was obtained by FFT transformation, as shown in Figure 7.
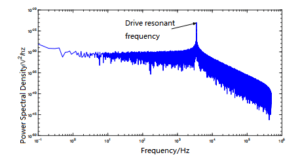
Figure 7 Power spectrum density of drive displacement noise simulation
As can be seen from Figure7, the noise on the drive amplitude has an obvious peak value at the drive resonance frequency, and the simulation results are consistent with the theoretical analysis.
| Parameters | Numerical value |
| Driving resonant frequency ƒx | 3500 Hz |
| Driving equivalent mass mx | 6×10⁻⁷ kg |
| Drive mode quality factor Qx | 8000 |
| Driving mode equivalent damping cx | 1.65×10⁻⁶ |
| Torque circuit equivalent resistance Rƒx | 1.2×10⁵ Ω |
| Equivalent resistance of interface circuit Rpx | 1.2×10⁷ Ω |
| Voltage-electrostatic conversion gain Kvƒx | 8.26×10⁷ N/V |
| Displacement-capacitance conversion gain Kxc | 0.826 pF/um |
| Capacitance-voltage conversion gain Kcvx | 3.5 V/pF |
| Temperature T | 298K |
| Boltzmann constant kB | 1.38×10⁻²³J/K |
Table 1 Noise related parameters of the drive loop
Conclusion
In this paper, the noise model of the drive loop is established for the noise source in the measurement and control system, and then the noise model of the drive loop is analyzed through the power spectral density function, and the influence of the drive noise on the detection and control loop is emphatically discussed, and the expression of the noise superimposed on the drive displacement amplitude is obtained. Finally, the noise model of the drive loop is modeled, and the simulation results are consistent with the theoretical analysis.
Ericco is a professional research and development team for MEMS gyroscope, mainly for tactical and navigation grade MEMS gyroscope, such as the navigation grade ER-MG2-50/100, whose zero bias instability can reach 0.01-0.02°/hr. The tactical grade ER-MG2-069 has zero bias instability <0.1°/h.
I hope you can understand MEMS gyroscope through this article, if you want to learn more about MEMS knowledge, please click the related products and related articles below.
More Technical Questions
1.Basic dynamics analysis of MEMS gyroscope
2.System error and calibration of MEMS gyroscope
3.Sensitive structure analysis of MEMS gyroscope
4.The analysis of damping in MEMS gyroscope
5.The impact of turntable error on MEMS gyroscope calibration
6.Bias Temperature Compensation Analysis of MEMS Gyroscope
Products in Article
.jpg)