The emergence and rapid development of MEMS (Micro Electro Mechanical System) inertial sensors are promoting the miniaturization of inertial navigation systems. The strategic and tactical value and significance of MEMS inertial technology and micro navigation systems in national defense and military have become prominent.
MIMU is a key unit in inertial systems, and its accuracy determines the performance of the system to a large extent. However, the output signal is usually noisy and non-stationary, and includes influences such as the experimental environment. Therefore, the output signals of the gyroscope and accelerometer obtained from the MIMU unit should be denoised to improve the output accuracy of the MIMU. This article focuses on MEMS-IMU signal denoising technology and uses three different methods: median average method, IIR digital filtering method and wavelet denoising technology to remove noise in the MIMU output signal. Through comparative research on the processing results, the applicability and superiority of wavelet transform in signal denoising processing are confirmed, and the output accuracy of MIMU is improved. This improves the performance of the inertial navigation system.
1.Traditional filtering and denoising method
1.1 Median average filtering denoising
The median average filtering algorithm is one of the simplest signal processing methods. The specific algorithm steps are as follows:
(1) Sort the signals and take the middle value as the median.
(2) Subtract each data point in the signal from the median to obtain the difference.
(3) Average the differences to obtain the average value.
(4) Add the median and average values to obtain the filtering result.
The formula of the median average filtering algorithm is as follows:

The data below is the data of 1000s under static conditions of MEMS-IMU, and the actual sampling frequency is 50Hz. This data is smoothed at 10 sampling points in the experiment. The processing results are shown in the figure below. It can be seen from the figure that the processed signal is relatively smooth.

Comparison of gyroscope and accelerometer signals before and after median averaging processing
1.2 IIR digital filtering and denoising
Digital filters are divided into IIR (infinite impulse response filter) and FIR (finite impulse response filter). The IIR filter has zero points and can achieve better filtering effects with smaller orders and requires less calculation. Smaller, so IIR filter design is used. Since the frequency band of micromechanical devices is narrow and the Butterworth low-pass filter has the largest flatness characteristics in the low frequency band, the Butterworth low-pass filter is considered.
(1) Spectrum analysis of MIMU output signal
The data below are the output signals of the gyroscope and accelerometer acquired by the navigation computer and subjected to fast Fourier transform.

Gyroscope and accelerometer signal spectrum plots
Observing their spectrum diagrams, as shown in the figure above, it can be seen that the high-frequency interference noise of the gyroscope is very large, almost equal to the amplitude of the useful low-frequency signal;
(2) Digital filter design
Designing an IIR filter generally involves designing an analog filter first, and then converting the analog filter into a digital filter. The square amplitude-frequency characteristic function of the simulated Butterworth filter is:

The transfer function and frequency response of an analog system are related by s=j Ω, so the transfer function Hn (s) of its normalized low-pass filter can be obtained as:
![]()
The design steps for an analog filter are:
(1) Given the passband Ω1 and stopband frequency Ω2, the corresponding attenuation coefficients ap and as;
(2) Find the order N of the filter according to the following formula;

Find the cutoff frequency Ωc from the following formula;

Obtain the filter order N and cutoff frequency Ωc according to the above method, so that the transfer function Hn (s) of the analog filter can be obtained, and the analog filter is converted into a digital filter through bilinear mapping. Taking into account the overall requirements, the system requirements Design a digital low-pass filter with technical specifications: fp=10Hz, fs=30Hz, ap=4dB, as=20dB, and a sampling frequency of Fs=50Hz. Substituting into the design formula, the filter order N=5 can be obtained. Use this filter to filter the original signal. The filtered signal spectrum and signal diagram are shown in Figure 3.3. From the figure, it can be seen that the high-frequency noise in the signal is significantly reduced.

Comparison of gyroscope and accelerometer signals before and after IIR digital filtering
2.Wavelet denoising technology
2.1 Principle of wavelet denoising
Wavelet transform theory is a branch of applied mathematics developed in the late 1980s. It is a time-frequency analysis method of signals, which has the characteristics of multi-resolution analysis, and has the ability to characterize the local characteristics of the signal in both time and frequency domains. It is a window with a fixed size but a shape that can be changed. The time window and It is a time-frequency localized analysis method in which the frequency domain window can be changed, so it is known as a signal analysis microscope.
Inspired by the tower algorithm for image decomposition and reconstruction, Mallet proposed a fast algorithm for wavelet decomposition and reconstruction based on the multi-resolution theory, called the Mallet algorithm. This algorithm's status in wavelet transform is equivalent to FFT in Fourier transform. position in.
(1) Signal decomposition process of Mallet algorithm
The Mallat algorithm, also known as the tower algorithm, uses wavelet filters H0, H1 and G0, G1 to decompose and reconstruct the signal. The decomposition algorithm is as follows:

Among them, t is the discrete time sequence number, f(t) is the original signal; j is the number of layers, H0 and H1 are the wavelet decomposition filters in the time domain, and Aj is the approximate part of the signal f(t) in the jth layer. Wavelet coefficient, Dj is the wavelet coefficient of the detailed part of signal f(t) in the jth layer. Assume that the discrete signal f(t) is A0, and the signal f(t) is in the approximate part of the 2jth scale, that is, the wavelet coefficient of the low-frequency part is the wavelet coefficient Aj-1 of the approximate part of the 2j-1th scale and the decomposition filter H1 Convolution, and then sampling the convolution result at intervals, the detailed part of the signal f(t) on the 2j scale, that is, the wavelet coefficient Dj of the high-frequency part is the approximate part of the wavelet coefficient Aj-1 through the 2j-1 scale Convolved with the decomposition filter H0, the convolution result is obtained by sampling at every other point. By decomposition, at each scale 2j, the signal f(t) is decomposed into wavelet coefficients Aj of the approximation part (low-frequency subband) and wavelet coefficients Dj of the detail part (high-frequency subband). The wavelet decomposition algorithm is shown in the figure below.

Schematic diagram of wavelet decomposition algorithm
(2) Signal reconstruction composition of Mallet algorithm
The reconstruction algorithm is as follows:

In the above formula, G0 and G1 are wavelet reconstruction filters in the time domain. The wavelet coefficient Aj of the low-frequency part is convolved with the reconstruction filter G0 through the wavelet coefficient Aj+1 of the approximation part of the 2j+1 scale after zero interpolation at every other point, and the wavelet coefficient of the detail part of the 2j+1 scale is interpolated with zero at every other point. The reconstruction filter G1 is convolved and then summed. This process is repeated until the 20th scale to obtain the reconstructed signal. The wavelet reconstruction algorithm is shown in the figure below.

Schematic diagram of wavelet reconstruction algorithm
(3) Small waveform analysis and denoising of signals
The process of using wavelet analysis algorithm to denoise the signal is as follows: first perform wavelet decomposition on the signal, and then process the coefficients after wavelet decomposition in the form of threshold domain values; then perform wavelet reconstruction on the signal, so that elimination can be achieved noise purpose. Generally speaking, as the transformation scale increases, the resolution becomes higher and higher, and the filtering effect becomes better and better. However, in practical applications, factors such as the amount of calculation and rounding error of calculation must be taken into consideration, so the required wavelet transform scale is determined based on the actual accuracy requirements and various influencing factors. In the paper, based on the comparison of the effects of different wavelet bases and different decomposition layers, the 5-level Debauches2 wavelet was selected for the signal.
Summarize
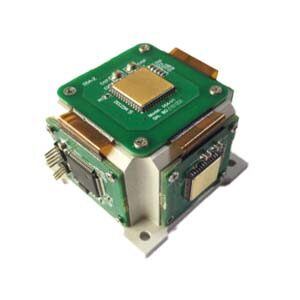
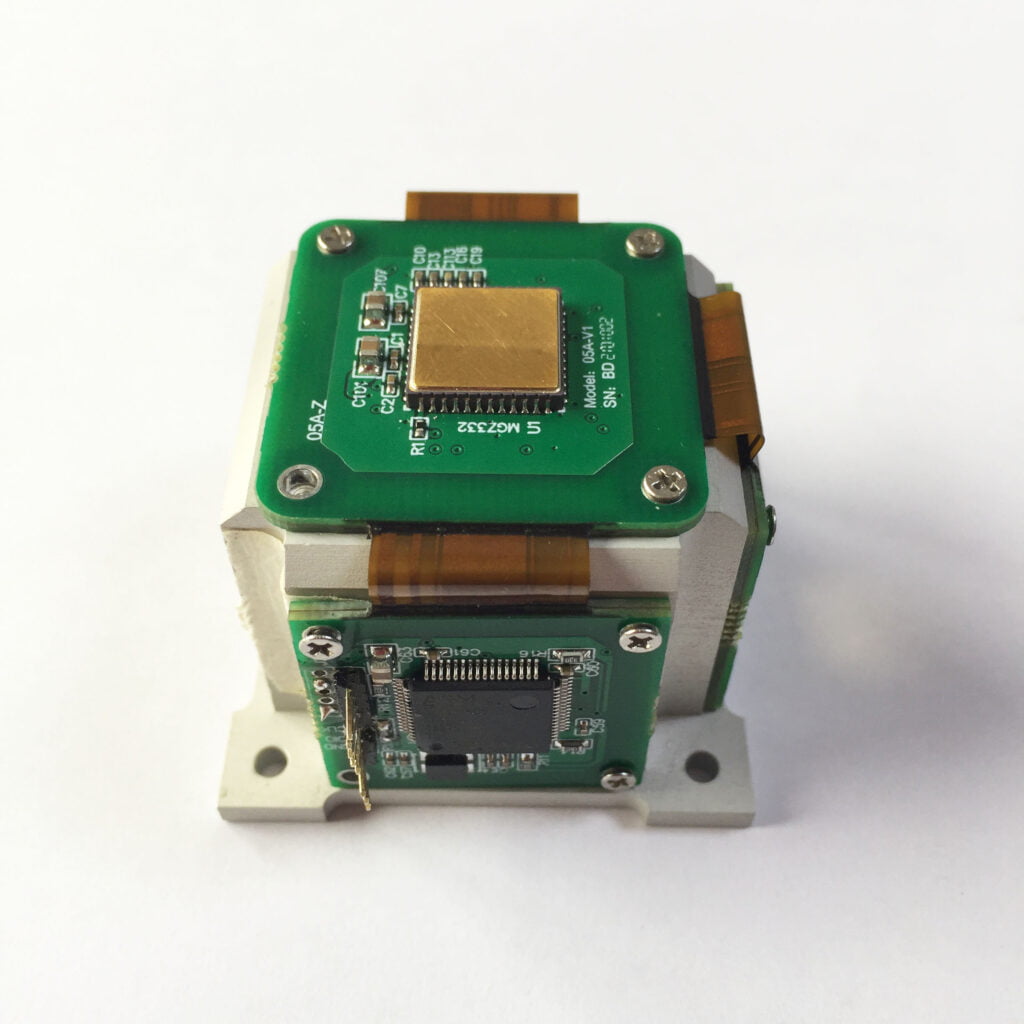
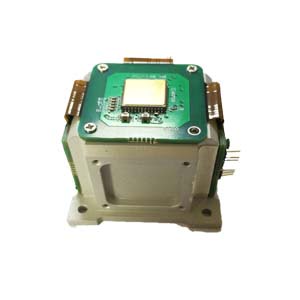
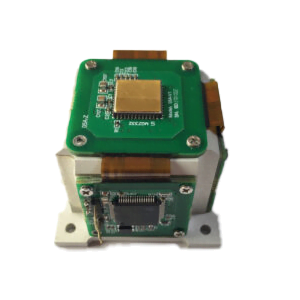
Three different methods: median averaging method, IIR digital filtering method and wavelet transform all have certain effects on removing noise in MIMU output signals. Among them, the median average method is the simplest and has the shortest filtering time, so it is a more commonly used method. However, when the MIMU outputs a high dynamic signal, this method cannot be used, and the IIR digital filtering method or the wavelet denoising method must be used for denoising. The time of digital filtering is relatively short, while the wavelet denoising method requires decomposition and reconstruction of the signal, which takes a longer time, but the accuracy of wavelet denoising is higher than that of digital filtering. Therefore, when we use high-performance hardware, we can implement wavelet transform with fewer decomposition levels for denoising, thereby improving the inertial navigation accuracy to a certain extent. As a company specializing in inertial navigation products, ERICCO focuses on the development and research of high-performance MEMS IMUs and conducts professional signal denoising for navigation-level IMUs and tactical-level IMUs. For example, ER-MIMU-01 and ER-MIMU-05 have less signal noise interference and have many application fields, such as oil exploration, bridges, high-rise buildings, towers, dam monitoring, geotechnical monitoring, mining, etc. , can reduce interference through signal noise denoising.
If you are interested in other products and knowledge about MEMS IMU, please click on the products and articles below to continue learning.
More Technical Questions
1.Choosing an IMU: FOG IMUs vs MEMS IMUs
2.IMU working principle & Tactical grade IMU product recommendations
3.Inertial Measurement Unit Error Calibration
4.IMU algorithm: data acquisition & calculation of speed and direction
5.Influence analysis of IMU accuracy on spoofing detection algorithm
6.IMU self-calibration based on factorization
Products in Article