
1. Performance test content
The main indicators of the MEMS tilt sensor sensor chip include static capacitance, static performance test and dynamic performance test. The static performance test includes measurement range, sensitivity, linearity, transverse sensitivity and zero stability. The dynamic performance test is mainly the bandwidth test.
1.1 Static capacitance test
The static capacitance test was performed using wafer probe bench and Agilent 4294A impedance analyzer, as shown in Figure 4.10, mainly for screening MEMS tilt sensor sensitive chips before packaging.

The specific steps of static capacitance test are as follows:
(1) The sensitive chip prepared by the lead pad is placed on the table of the probe table in the 0g state;
(2) The measurement mode of the impedance analyzer is set as impedance-frequency test, the sweep frequency range is 2kHz~3kHz, and the excitation source voltage amplitude is 0.5V;
(3) Adjust the two probe bases, and contact the probe with the top cover pad and the middle sensitive structure layer pad respectively to obtain the impedance-frequency test curve, as shown in FIG. 4.11 (a), and obtain the equivalent capacitance by fitting;
(4) Adjust the two probe bases again, and contact the probe with the bottom cover plate of the sensitive chip and the welding pad of the middle sensitive structure layer respectively to obtain the impedance-frequency test curve, as shown in Figure 4.11 (b), and obtain the equivalent capacitance by fitting.
It can be seen from the test that the static capacitance of the middle sensitive structure layer and the upper and lower cover plate of the sensitive chip is 5.24pF and 5.16pF respectively, which has a good symmetry.

1.2 Static Performance testing
The static performance test of MEMS tilt sensor sensitive chip mainly includes range, sensitivity, linearity, lateral sensitivity and zero stability. The schematic diagram of static performance test is shown in Figure 4.12. Specific test methods and test results are as follows.
(1) Range, sensitivity, linearity test
① Test method
At room temperature in the laboratory, n Angle points are selected at basically equal intervals through the indexing head in the whole measurement range, corresponding to n acceleration value ai. Selection of + 90° range - 90°, 75°, 60°, 45°, 30°, 15°, 0°, 15°, 30°, + + + 45°, 60° +, + + 90° 75°; Plus or minus 30° range selection - 30°, 25° ~ 20°, 15° to 10°, 5°, 0°, + 5°, + 10°, 15° + + 20°, 25°, 30° + +; ±15° Range selection -15°, -12.5°, -10°, -7.5°, -5°, -2.5°,
0°, +2.5°, +5°, +7.5°, +10°, +12.5°, +15°.
The input acceleration ai and the output value xi are linearly fitted using the least square method, and the fitting line is obtained as follows:

Where, E1 is the sensitivity of the sensor sensitive chip, and the residual difference between the output value and the above fitted line is further calculated, and the maximum absolute value of the residual difference δmax is found. According to equation (4.4), the absolute acceleration linearity of the sensor sensitive chip ξ can be obtained, and the absolute Angle linearity of the sensor sensitive chip α can be obtained by inverting Sin to ξ.


② Test procedure
a. Install the MEMS tilt sensor sensitive chip test board on the precision optical indexing head, ensure that the sensitive direction of the sensitive chip is perpendicular to the rotating shaft of the indexing head, connect the power supply and serial data acquisition line;
b. After the installation is complete, power the test board, stabilize for 10 minutes, and use 0° near the zero position of the sensitive chip
And 180° two-point method to determine the mechanical zero position of the sensitive chip.
c. According to JJF 1427-2013 "Micro-electromechanical (MEMS) line accelerometer calibration specification", the range, sensitivity,
Linearity test.
③ Test results
FIG. 4.13 (a) ~ (c) shows the sensitive characteristic curves of the MEMS tilt sensor sensor sensor in the range of ±90°, ±30° and ±15°, respectively. The linear fitting curves and residual errors are obtained by least square fitting of the curves, and the linearity results are obtained by equations (4.4) and (4.5). Detailed test results are shown in Appendix A, Schedule A.1~ Table A.3.

According to the static input and output curve of the sensor sensor chip, the sensitivity of the sensor sensor chip can be obtained as
477716LSB/g, since the corresponding capacitance range of the AD7745 is ±4pF in the 24-bit digital quantity variation range (16777216 LSB), it is calculated that the actual capacitance-acceleration sensitivity of the sensor sensor chip is about 0.228pF/g. In the range of ±90°, the linearity of acceleration is 0.19%FS, and the linearity of Angle is 0.22°. In the range of ±30°, the acceleration linearity is 0.11%FS and the Angle linearity is 0.06°. The acceleration linearity in the ±15° range is 0.06%FS and the angular linearity is 0.017°. These indexes can meet the requirements of conventional industrial inclination measurement.
(2) Lateral sensitivity test
① Test method
Put the sensor sensitive chip in the horizontal state, coincide with the rotation axis of the indexing head, rotate the indexing head in the clockwise (or counterclockwise) direction, take the equal Angle θ=30°, and test in 7 angular positions, that is, θi=0°, 30°, 60°,...... 180°, record the output value Ei1 at each position and the output value Ei2 at each position when the sensor sensor chip is flipped 180°. The lateral sensitivity of the sensor sensor chip can be obtained according to the formula (4.6).

Where, TSR is the cross sensitivity, S is the sensitivity, Ei1 is the output value at θi, Ei2 is the output value after flipping 180° relative to θi, and g is the acceleration of gravity. The maximum TSR calculated is the transverse sensitivity of the sensor sensor chip.
② Test procedure
a. Install the MEMS tilt sensor sensitive chip test board on the precision optical indexing head, ensure that the sensitive direction of the sensitive chip coincides with the rotation axis of the indexing head, and connect the power supply and serial data acquisition line;
b. After installation, supply power to the test board, stabilize for 10 minutes, and determine the mechanical zero position of the sensitive chip by using the 0° and 180° method near the installation zero position of the sensitive chip.
c. Perform lateral sensitivity test according to JJF 1427-2013 "Microelectromechanical (MEMS) Line accelerometer Calibration Specification".
③ Test results
According to the above test methods and test steps, the lateral sensitivity of the MEMS tilt sensor sensor chip can be obtained
The degree is 5.2%FS, and the specific test data are shown in attached Table A.4. The index is still not ideal, the main reason is that the current package shell size is large, the sensitive chip mounting no reference, it is easy to lead to mounting deviation Angle, resulting in sensitive direction sensitivity of the sensitive chip leakage in the non-sensitive direction, which has a direct impact on the horizontal sensitivity index.
(3) Zero stability test
① Test method
Set the sensitive direction of the sensor sensor chip to the horizontal state, coincide with the rotation axis of the indexing head, and record the output value of the prototype E1, E2, E3,...... EN, calculate the zero stability of the sensitive chip according to formulas (4.7) and (4.8).

Where, K1 is the sensitivity of the sensor sensitive chip, which is 477716LSB/g according to the previous test results, and σ is zero stability.
② Test procedure
a. Install the MEMS tilt sensor sensitive chip test board on the precision optical indexing head to ensure the sensitive chip
The sensitive direction is perpendicular to the rotating shaft of the indexing head, and the power supply and serial data acquisition line are connected.
b. After installation, supply power to the test board, stabilize for 10 minutes, and determine the mechanical zero position of the sensitive chip by using the 0° and 180° method near the installation zero position of the sensitive chip.
c. Conduct zero stability test according to JJF 1427-2013 "Micro-electromechanical (MEMS) Line Accelerometer Calibration Specification", test time 1h.
③ Test results
The test results of zero stability are shown in Figure 4.14

2 Summary
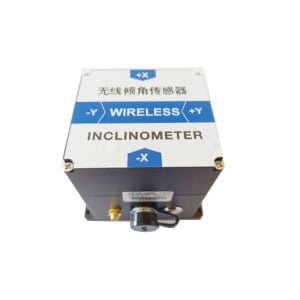
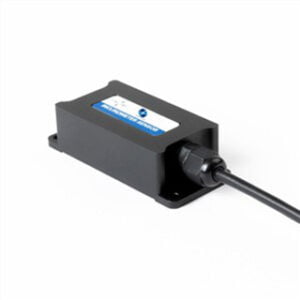
The calculation shows that the 1h zero stability of the sensor chip is about 81.3μg, which can meet the requirements of conventional industrial inclination measurement. Ericco's ER-TS-3160VO and ER-TS-4158CU, which we have tested for static performance, have a high level of protection and can work in harsh industrial environments for a long time.
More Technical Questions
1.How to Improve Accuracy of Tilt Sensors
2.Analysis of Influencing Factors of Measurement Error of Tilt Sensor
3.How to Compensate Temperature of Tilt sensor
4.Stability Test and Analysis of Tilt Sensor
5.How to Improve Reliability of Tilt Sensors
6.Tilt Sensor Automatic Calibration System
Products in Article