As a kind of angle measuring instrument, tilt sensor is widely used to measure the vertical angle of missile launching guide rail and the attitude measurement of engineering equipment.
In practical applications, the measurement focus of inclinometer sensor is stability measurement, so improving the stability of inclinometer sensor measurement becomes the most important thing. Because the external temperature has a great influence on the stability of the sensor, we focus on the test and comparative analysis of the working stability of the two tilt sensors in the field environment.
During the test, two inclinometer sensors using the same accelerometer were selected in the same field environment, and their starting characteristics, static stability and dynamic following were tested. Experimental data of the two sensors were collected and compared.
1. Sensor stability test
In the stability test of tilt sensor, according to the use of the tilt sensor on the installed equipment, this paper focuses on the test of the start-up characteristics, dynamic following and static stability of the tilt sensor. The measurement accuracy of the two inclinometer sensors selected for testing in this paper is 0.016°, and the inclination Angle of the test equipment is 60°. Before starting, the inclination sensor is in the horizontal state. The two tilt sensors selected during the test are named Sensor A and Sensor B.
1.1 Test Purpose
After a series of tests, the start-up, dynamic following and steady-state characteristics of the inclinometer sensor are obtained, which are easy to form charts for analysis.
1.2 Test Equipment
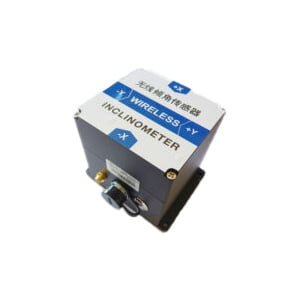
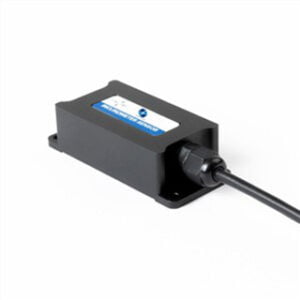
The two inclinometer sensors selected in this paper are finished products, which are applied to the mechanical equipment to be tested as test equipment.
1.3 Test Environment
Because the test data obtained by the two sensors needs to be compared, the test environment of the two sensors is placed in the same place at the same time, that is, the test equipment is placed at the site where the device is used.
1.4 Test Platform
The tests were mainly conducted on two vertical devices. In the test process, firstly, the selected two inclinometer sensors are installed in the installation position of the test equipment and installed according to the sensor instructions; After that, power and communication checks are carried out on the inclination sensors to ensure that the two sensors can work normally. Finally, the test is carried out according to the test steps, and the output data in the whole process of sensor test is recorded.
1.5 Test Content
This paper mainly tests the starting characteristics, dynamic following and steady state characteristics of the two tilt sensors, that is, the normal use process of the test equipment. Since the entire process of using the sensor on the test device is tested, the test will be divided into three phases and conducted several times.
1.6 Test Procedure
The whole test process is relatively simple, and the test step flow is shown in Figure 2.

1.7 Test data analysis
Since the inclinometer sensor is tested in a field environment, it is necessary to consider the temperature change of the environment. In this paper, the field environment temperature change curve is simulated as a sine curve, as shown in formula (1) :
f(t)=ksin((t×2π)/T) (1)
Where, t -- time, the value is the test time point;
k -- the difference between the highest and lowest temperature of the day, which in this paper takes the value of 24 ° C;
T -- Time period, the value is 24 h. The test was conducted during the day, and the rate of temperature change was faster, so
We take the derivative of f(t). By substituting the values obtained in the test into the derivation formula, the fastest temperature change rate can be obtained, that is, 0.1 ℃/min.
1.71 Testing Startup features
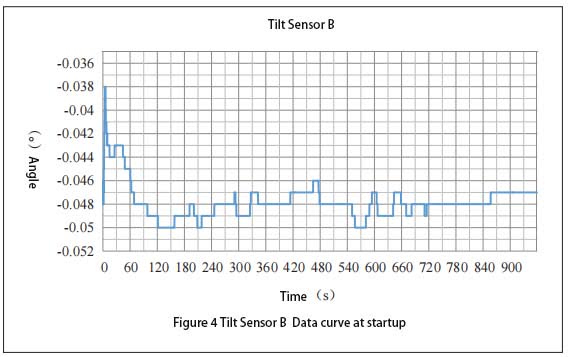
The equipment equipped with the inclination sensor is placed on the test site, and the measuring part of the sensor is placed in the horizontal state. At this time, the sensor is operated with power off. Power on the sensor two hours later and record the data generated within one hour after the sensor is powered on. Figure 3 shows the data curve of A and Figure 4 shows the data curve of B. It can be seen from Figure 3 that the Angle measurement value of A is 0.002° within 1 minute of power-on; The measurement value fluctuates from 0.001° to 0.002° and changes rapidly after 1 to 5 minutes of power-on. The measurement error is 0.001°. From 5 minutes to 14 minutes of power-on, the measured value fluctuates between 0.001° and 0.002°, while the fluctuation frequency is low, and the measurement error value is 0.001°. The measured value is stable after 14 minutes of power-on. It can be seen from the above that the Angle sensor selected in the test gradually stabilizes after 1 minute of power-on start-up. As can be seen in FIG. 4, the Angle measurement value of B is -0.048° after 15 minutes of power-on and start-up, the output measurement value reaches a steady state, and the measurement error value is 0.001°. The measurement value between 4 minutes and 15 minutes is -0.048°, and the measurement error is 0.002°. The measurement value between 1 minute 30 seconds and 4 minutes is -0.049°, and the measurement error value is 0.001°. The measured value is -0.048° within 1 minute and 30 seconds after power-on. The measurement error is 0.002° between 1 minute 30 seconds and 15 minutes after power-on and start-up, and then reaches stability.
The comparison between FIG. 3 and FIG. 4 shows that A reaches the stable state faster than B during power-on start-up; For A period of time after reaching stability, the measurement error of A is smaller than that of B.

1.72 Dynamic characteristic test
The Angle sensor is powered on and started. After the output measurement value is stable, the installation position of the vertical Angle sensor is raised. When the output data of the tilt sensor is obtained, the output measurement data of the sensor will be obtained to generate a curve. In addition, the parameters of device erection are obtained from the sensor mounting device, and the motion curve of the device erection is generated. The lag Angle data of the measured value of the sensor can be obtained by making A difference between the two curves. The lag curve of A is shown in Figure 5, and the lag curve of B is shown in Figure 6. As can be seen in Figure 5, the device is in a horizontal state before 35 s, and performs vertical action between 35 and 43 s. After 43 s, the sensor enters a stable state again. At 35 s, the device changes from a static state to a dynamic state, the hysteresis curve bulges downward, and the measured value of the sensor follows the device with good dynamic following. After that, the hysteresis of the sensor gradually increases, and the hysteresis reaches a maximum of 4.5° between 41 and 42 s. Finally, the Angle lag value becomes smaller and gradually becomes zero.
As can be seen from FIG. 6, the erecting process of B is the same as that of sensor A. When the device is erecting at 35s, the measured value of the sensor does not follow the sensor. After the device is erecting at A certain Angle, the measured value of the sensor will change the output, and the lag reaches a maximum of 3° between 41 and 42s. Finally, the angular lag value becomes smaller and gradually becomes zero.
The comparison between FIG. 5 and FIG. 6 shows that sensor A has better dynamic tracking performance than sensor B. When the lag between sensor and device reaches a certain degree, sensor B will use a new data processing method to improve sensor B's tracking performance.


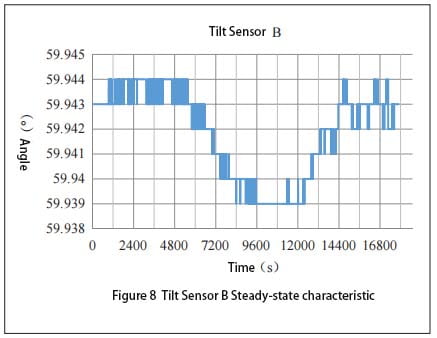
1.73 Steady-state characteristic test
After the device is raised from the horizontal state to 60°, wait for the measurement data output by the inclinometer sensor to stabilize, continue to monitor and collect the sensor output data, and finish the test 5 to 6 hours later. The data generated during the steady state of the sensor is processed. The steady state curve of A is shown in Figure 7, and the steady state curve of B is shown in Figure 8. It can be seen from FIG. 7 that the output measured value of sensor A is relatively stable in the first 1 hour and 30 minutes. After 1 hour and 30 minutes, the measurement value began to shift to a large place, and reached a maximum value at 2 hours and 20 minutes, and then the deviation became smaller. At 4 hours it returns to its initial stable state again. Sensor A has a maximum offset of 0.007° when the temperature changes violently.
It can be seen from FIG. 8 that the output measured value of sensor B is relatively stable in the first 1 hour and 40 minutes. After 1 hour and 40 minutes, the measured value began to shift to a smaller place, and reached a maximum value at 2 hours and 30 minutes, and then the offset value became smaller. At 4 hours it returns to its initial stable state again. When the temperature change of sensor B is relatively drastic, the maximum offset of the measured value is
0.005°. Comparing FIG. 7 and FIG. 8, it can be concluded that under the same temperature change rate, the deviation of inclinometer sensor A is larger than that of inclination sensor B, and the measurement error of inclinometer sensor A is 0.001° larger than that of inclination sensor B. It can be seen that the steady-state characteristic of inclination sensor B is better than that of inclination sensor A.

2 Summary
The starting characteristic, dynamic characteristic and steady-state characteristic of the inclinometer sensor are tested. Through comparative analysis of the test data, the starting characteristic and following characteristic of the inclination sensor A are better. The dynamic lag of inclination sensor B is small, and the Angle deviation is small in steady state and drastic temperature changes.
When we choose the inclination sensor suitable for the device's use environment, such as ER-TS-12200-Modbus and ER-TS-32600-Modbus, we do not know which one to choose, we can conduct stability test and analysis on it according to the above method. According to the test data results to choose a more suitable one.
More Technical Questions
1.How to Improve Reliability of Tilt Sensors
2.Tilt Sensor Automatic Calibration System
3.Research on Angle Control Technology of Tilt Sensor
4.Tilt sensor, Tilt Switch&Other Common Problems in Installation and Use Process
5.Application of Tilt Sensor in Vehicle Four-wheel Positioning
6.Tilt Sensor Use and Maintenance Precautions
Products in Article